How to use your browser web inspector to find and resolve website problems

The browser Web Inspector tool is included with all desktop browsers that I’ve used. Developers use the web inspector to debug Javascript, HTML, CSS, and even help identify some server errors. This makes the web inspector a powerful development tool to help narrow down website problems, particularly ones like this:
- Errors that don’t appear immediately upon page load and instead occur after the page has loaded. This could be after a period of time or after interacting with something else on the page such as a button that doesn’t work.
- Problems with page rendering, such as missing images, styles (colours, layout, etc) or iframes like embedded Google Maps or external forms.
- Style and spacing issues on the page (margins, paddings, items off-screen, etc)
- Some WordPress plugin conflicts.
- Mixed content warnings.
Tip: if you’re having issues with saving a WordPress page powered by a page builder, you should first check out our guide to troubleshooting page builders issues.
How to access the web inspector utility
Here’s how to get to your browser web inspector in all major browsers. If your browser is not in the list, you can always find the answer to this in the browser’s help/support website.
- Google Chrome: under the View menu, choose Developer > JavaScript Console
- Mozilla Firefox: under the Tools menu, choose Browser Tools > Web Developer Tools > Switch to the “Console” tab
- Apple Safari: under the Safari menu, choose Preferences > Advanced (tab) > Check the box at the bottom called “Show Develop menu in the menu bar”. Then go to the Develop menu > “Show JavaScript Console”
- Microsoft Edge: under the Tools menu, choose Developer > JavaScript Console
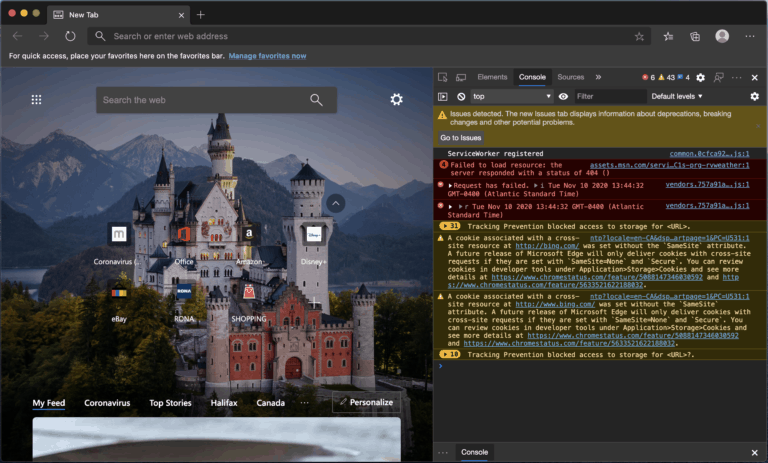
Here’s what each of them looks like. They’re all very similar.


Most warnings, except mixed-content warnings, are unlikely to have any effect on the functionality of the website, so you can usually ignore those unless you have absolutely no other leads.
Determine which developer tool you need
The next steps are going to depend on the type of issue you’re troubleshooting. Here’s how we break it down for you:
- Investigating CSS Visual Glitches
- Handling Suspected Server Errors
- Mixed Content Warnings
- JavaScript Errors
For details on each of these, scroll the matching section below.
Investigating Visual Style Glitches
Tip: If the entirety of your styles are missing, you should skip down to mixed content warnings or server errors. If there’s just a single or a couple elements with glitches, read on!
Open whichever page you’re encountering the visual glitch on and right click on the element that isn’t displaying as you’d like. Choose the option to “Inspect” or “Inspect Element” this will open the web inspector already focused on that particular element on the page so you don’t have to go looking for it manually.
Tip: The inspector’s view of the page is called the DOM Tree. It’s a tree because the page starts at the ‘top’ of the tree with the <html> element and then cascades down all of its sub elements from there. Sub elements are called children, and the ones above any given element are called parents. Anything at the same level as the element you’re looking at are siblings.
It’s possible the Inspector narrowed in too closely (or even too widely) on the element you selected – using the terms of the DOM Tree, you may be looking at a child or parent element of the thing you really need to be looking at. When you hover over the element, most browser inspectors will show you its padding and margins (among a few other visual indicators) on the page. Therefore by hovering over parent and children elements, you can visually see which one has the CSS property/rule that offends you.
Once you’ve found the correct element, the CSS that applies to it is typically shown in the panel to the right of it. For example with spacing issues, you will typically see either padding (internal spacing) or margins (external spacing) specified there.
You can then either go to your visual page builder (like BeaverBuilder or Elementor) and know which element needs its padding or margins adjusted. Alternatively, if you don’t use a visual builder or the particular element doesn’t have the right style controls available in it, you can identify the correct CSS selector here, and write your CSS overrides accordingly (this will require a working knowledge of CSS).
Handling Suspected Server Errors
To ensure you see server-related errors, look for an option in the web inspector console to filter the output and ensure both “XHR” and “Requests” are visible. Alternatively you can go to the “Network” tab and refresh the page. Look for anything in the list that doesn’t have an HTTP status code of 200 or 30x. These are typically 400 and up.
- 403: This is either a permissions error or a firewall block. See our guide on resolving issues with web application firewall errors.
- 404: Either the file is missing and the solution is to ensure the file really does exist at the path it indicates (via FTP or Plesk File Manager), or if it’s not that, check out our guide to resolving missing stylesheets or javascript files.
- 500, 502, 504, etc: See our guide to resolving 50x errors.
If none of those guides do the trick, then our general guide to viewing and interpreting your web server logs should! You’ll very likely find corresponding entries in the server-side logs to the error you see in your web inspector. The server-side logs will usually give more detail as to the reason for the error which will help you resolve the problem.
Resolving Mixed Content Warnings
A mixed content warning occurs when some of the page content is coming from a variation of the URL that you’re accessing the site with. For example if you’re visiting the site at https://websavers.ca but images are loaded from http://www.websavers.ca both the protocol (http vs. https) and domain (websavers.ca vs. www.websavers.ca) are different. The most common reason for mixed content errors is the HTTP vs HTTPS URL differential on resources like photos. Look for errors and/or warnings like this:
[Warning] The page at https://your_url/ was allowed to display insecure content from http://your_url/wp-content/uploads/2015/12/web-design.jpg. (your_url, line 857)
These indicate which files are not being loaded via HTTPS. You will need to find where each of the listed content items (photo, javascript, css file, etc) is being loaded in the website code or website editor, such as the WordPress admin (e.g.: on a page? In the theme customizer settings? In the plugin’s settings? A background image loaded via the theme’s styles.css?), and change them to any of the following URL schemes, which will resolve this problem:
- Relative URLs by removing the entire first part up to the end of the domain. Ex:
/wp-content/subdir/myfile.jpg - Protocol Agnostic URLs by replacing the http:// with simply //. Ex:
//websavers.ca/wp-content/subdir/myfile.jpg - Absolute URLs by simply swapping http with https. Ex:
https://websavers.ca/wp-content/subdir/myfile.jpg
Or, if you’re using WordPress, you can take the easy way out and use a plugin that automatically forces the switch to https. Though this does have some performance implications.
Narrowing Down JavaScript errors
When you see Javascript errors in the browser console, they’ll indicate the .js file in which the error occurs and on what line.
However when you’re logged out of the site and the JavaScript is minified/optimized, it’ll be difficult to identify the code responsible because javascript files are frequently combined or reduced or both. To work around this, if you’re using WordPress, login to the admin, then attempt to reproduce the issue. If you’re using another content management system, you probably need to enable debug mode to prevent optimizations of the code from interfering with readability.
Example: if you’re using WordPress and the browser console indicates the .js file with the error is in wp-content/plugins/bb-plugin/ then the JavaScript is part of the BeaverBuilder plugin.
Once you know which plugin or theme’s javascript is reporting the error, check to see if there’s an update available for it. With the example above, you’d check to see if you can update the BeaverBuilder plugin. If no updates are available, pick from one of these two options:
- Complete exhaustive troubleshooting to determine if there’s a conflict with other software installed on your site.
- Report the exact error you found in the browser console to the plugin’s developers
You’ll probably want to pick option (1) if the error in the log isn’t very specific, or if the you know the software developer is not very responsive/helpful.
Experiencing an error in your JavaScript console that this guide hasn’t addressed? Let us know in the comments!
Posted in News & Info
About Websavers
Websavers provides web services like Canadian WordPress Hosting and VPS Hosting to customers all over the globe, from hometown Halifax, CA to Auckland, NZ.
If this article helped you, our web services surely will as well! We might just be the perfect fit for you.
